by Yogesh More
IBM® Engineering Lifecycle Optimization – Engineering Insights (ENI) provides the following two ways to trace the links and visualize the impact of change between the related artifacts.
- Dependency analysis (DA)
- Impact analysis diagram (IAD)
In this blog, we will compare the characteristics of Dependency Analysis and Impact analysis diagram to know when to use one over the other.
Pre-requisite:
- To know more about DA visit ENI View and IAD visit Impact Analysis
- Assume sample data (Money that matters) is installed in ENI and the user has the required license
Dependency Analysis
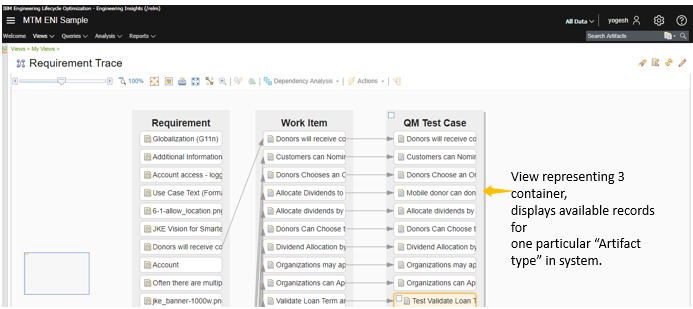
Views help you to visualize artifacts (requirements, work items, change requests, and so on) from various applications and explore the relationships among them. For example, Work Item from IBM Engineering Workflow Management can be linked to artifacts from other applications such as Requirement or Test case as shown below:

To create a dependency analysis report of an artifact, complete the following steps:
- In a view, hover over the artifact that you want to analyze
- Select the checkbox that appears
After you select the artifact, the Dependency Analysis icon is enabled.
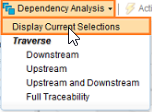
- Click Dependency analysis> Display current selections to keep only the selected artifacts in the view

The following four types of Dependency Analysis options are available:
- Upstream – Helps to explore the child artifacts of the selected artifact
- Downstream – Helps to explore the parent artifacts of the selected artifact
- Upstream & Downstream – Helps to explore the parent & child artifacts of the selected artifact
- Full Traceability – Helps to explore the parent and the child artifacts of the selected artifact and resulted in artifacts parent & child
All possible combinations of artifacts are confined to the containers that are available within the view. Hence this limits tracing of links to the available container (and links which connect them) in a view.
For example, when you run dependency analysis of the Allocate Dividends by an artifact from the Requirement container, its Full Traceability is shown as below:

In the above Full Traceability diagram, the links and the corresponding dependent artifacts are displayed. This helps the user to identify that if the user changes the selected requirement then how many test cases need to be updated. This way the user can find the linked records to know the impact of change.
Advantage: The dependency analysis diagram does not display unwanted data and keeps focus on the selected artifact.
Disadvantage: Users must know the domain to create correct views. User may miss adding some containers which may contain dependent artifacts. In such a case, those artifacts will not be traced.
Impact Analysis Diagram
Impact analysis Diagram helps teams trace the relationships among artifacts that are from different project areas. You can explore what artifacts are associated with a specific artifact.
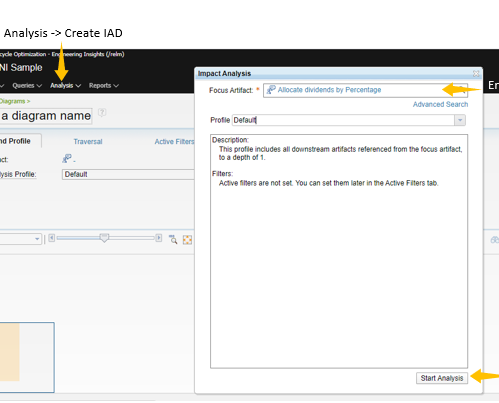
For example, let us explore the requirement “Allocate Dividend by” by using the impact analysis diagram:

The Impact Analysis diagram is created as shown here: When you click Start Analysis, the Impact Analysis diagram is created as shown below:

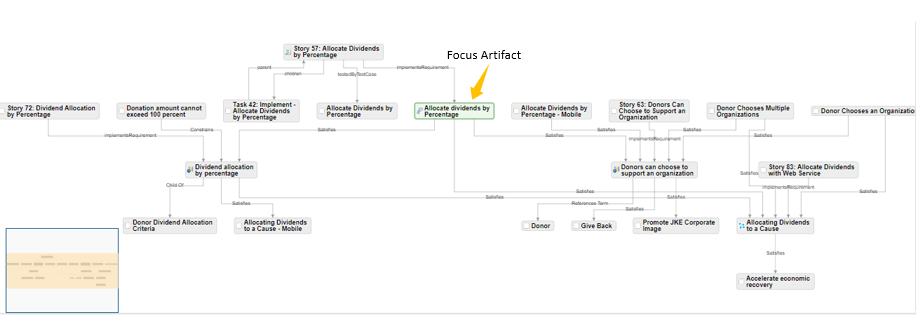
The default diagram is created with depth level 1 and Upstream traversal. You can change the depth of the analysis (Using Profiles), add artifacts, remove artifacts, and apply filters (IAD Filters) until you obtain the right information set.
After applying filters and selecting the depth level to 2, the following Impact analysis diagram is created:

As you can see, unlike dependency analysis within views, additional links (for example, Validate Requirement) and artifacts are pulled and displayed in the Impact Analysis Diagram. This helps to identify unknown dependent artifacts that are impacted.
Dependency analysis represents data in flat tree format while impact analysis can represent data in hierarchical, tree, circular and radial tree.
Tip:
- The new Impact analysis diagram uses the default filter which does not contain any criteria to filter. Therefore, all the linked data is shown in the diagram. You must create and use filters based on your needs to see the relevant data in the IAD. This helps to improve the performance of the impact analysis.
- Make use of the depth property from the Traversal tab to deep dive.
Summary
To summarize, you must have the domain knowledge (creating links, artifacts, etc.) to create the correct ENI views and then run dependency analysis on the ENI views. However, to run an impact analysis you do not require any domain knowledge. You need to just search the artifact, and then start impact analysis.
Table: Comparison of Dependency analysis and Impact analysis diagram
| Dependency analysis | Impact analysis diagram |
|---|---|
| When you run dependency analysis, you trace the dependent artifacts that exist within the context of the view. | When we do traceability using the Impact Analysis diagram you start with a single focused artifact. ENI explores all possible links across projects and then plots the dependencies for you. |
| To generate the dependency analysis of an artifact, the user must know links between the artifacts to create the view on which dependency analysis is performed. | Impact analysis does not require any domain knowledge. You must search for the artifact and then run the impact analysis. |
| Dependency analysis represents data in a flat tree format. | Impact analysis can represent data in hierarchical, tree, circular and radial tree. |
